Getting Started
What is PIC Simulator?
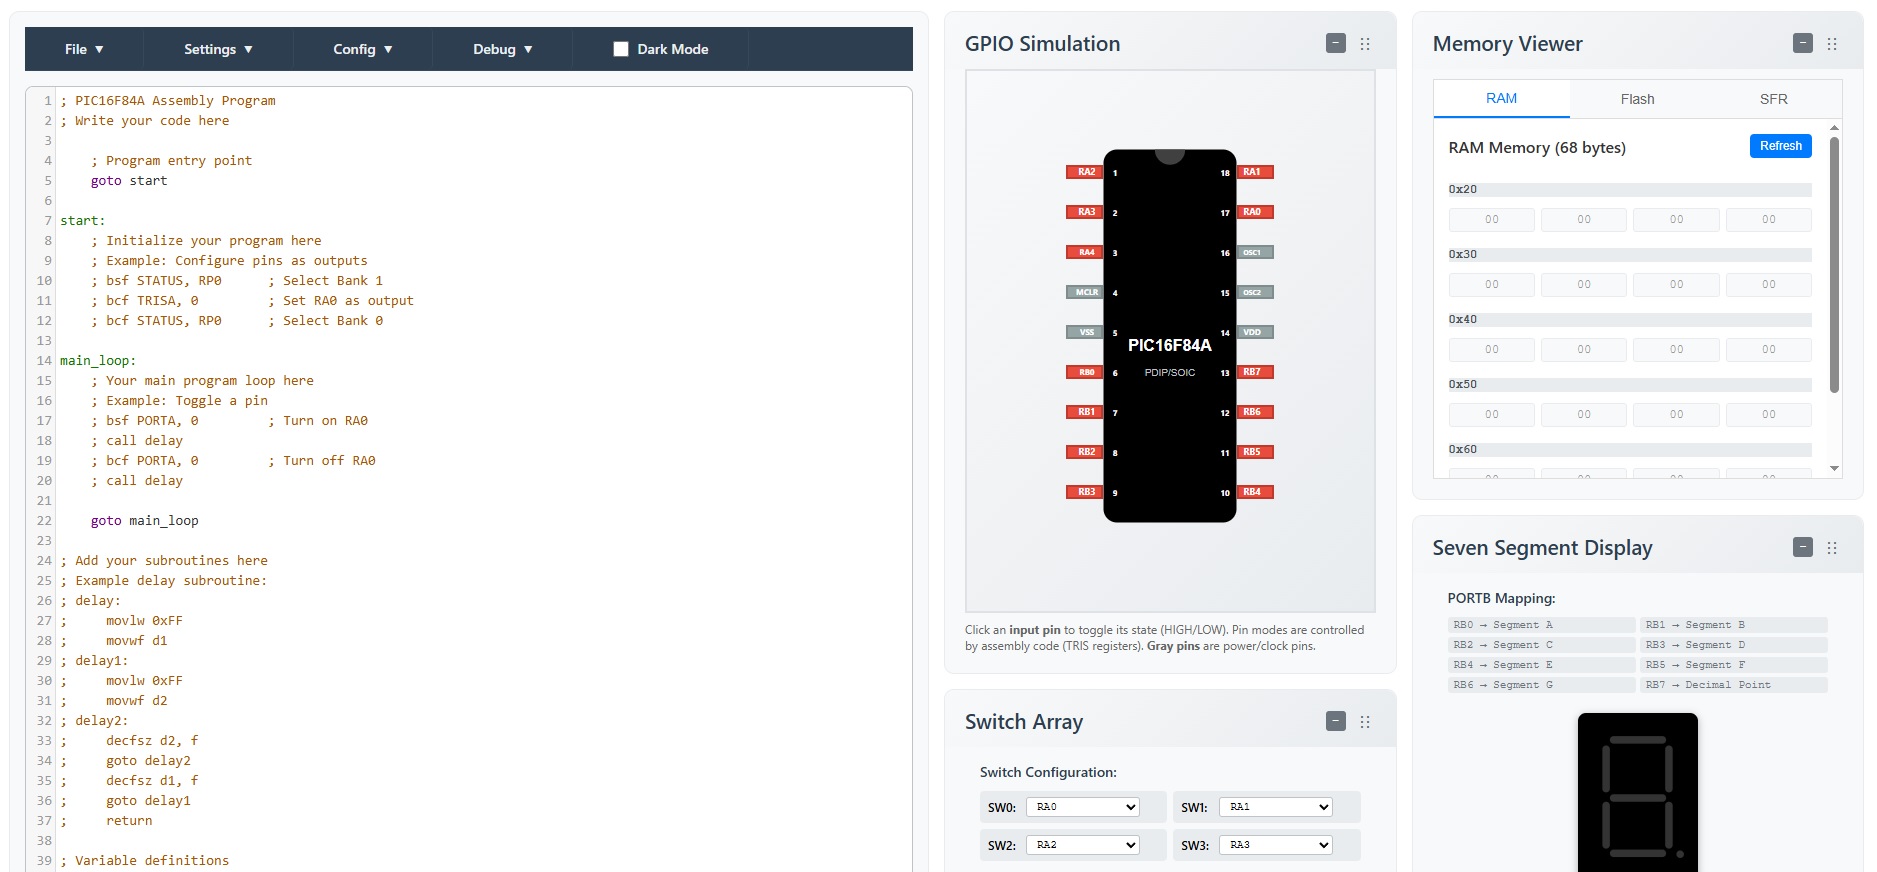
PIC Simulator is a web-based PIC microcontroller assembly language programming and simulation environment. It allows you to write, assemble, and simulate PIC assembly code directly in your browser without any additional software installation. The interface includes customizable widgets for debugging, GPIO control, memory monitoring, and display simulation.
System Requirements
- Modern web browser (Chrome, Firefox, Safari, Edge)
- JavaScript enabled
- No additional software required
Quick Start Guide
- Open the application in your web browser
- Select an example from the Examples menu
- Click "Assemble" to compile your code
- Click "Run" to start simulation
- Use GPIO controls to interact with your program
- Customize your workspace using the Widgets menu
Editor Features
Code Editor
The built-in code editor provides syntax highlighting and basic editing features for PIC assembly language.
Editor Controls
Syntax Highlighting
Advanced syntax highlighting for PIC assembly language including instructions, registers, directives, numbers, and labels. Variable names with numbers (like 'delay1') are properly highlighted as single tokens.
Line Numbers
Line numbers are displayed to help with debugging and code navigation.
Auto-indentation
Automatic indentation for better code structure and readability.
Error Highlighting
Assembly errors are highlighted in the editor with helpful error messages.
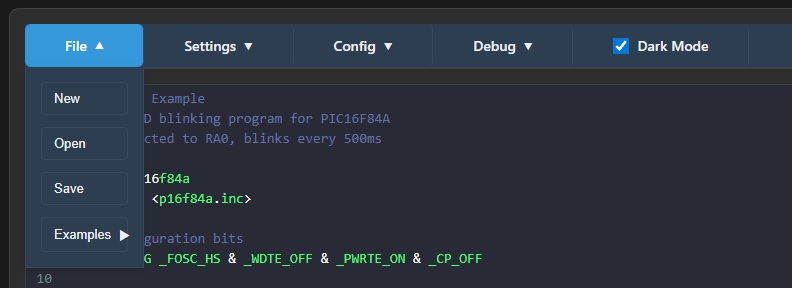
File Operations
- New: Create a new assembly file with a helpful blank template
- Open: Load an existing assembly file from your computer
- Save: Save your current work as a .asm file
- Examples: Load pre-written example programs
New File Template
When you create a new file or start the application, you'll see a helpful blank template that includes:
- Basic program structure with entry point and main loop
- Commented examples for common PIC operations
- Placeholder sections for subroutines and variables
- Proper PIC16F84A program format
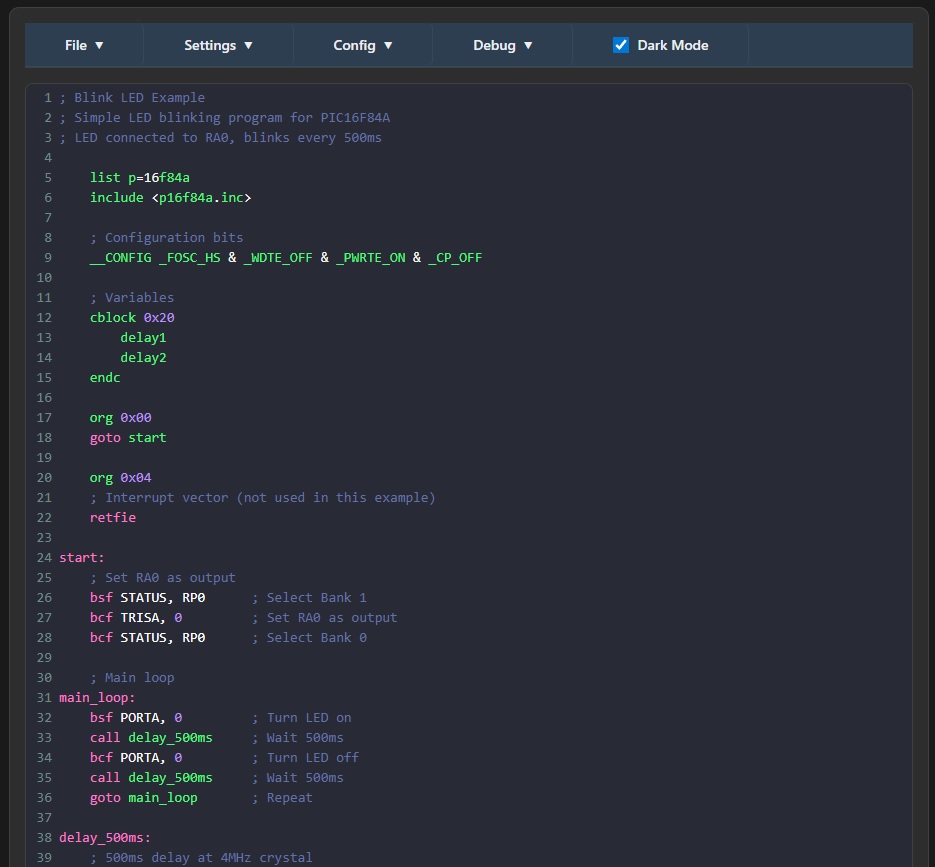
Dark Mode
PIC Simulator includes a comprehensive dark mode that can be toggled using the dark mode checkbox in the main menu. Dark mode provides:
- Dark backgrounds for all panels and widgets
- Light text for better readability
- Consistent dark theme across the entire application
- Professional appearance that's easy on the eyes
Assembler
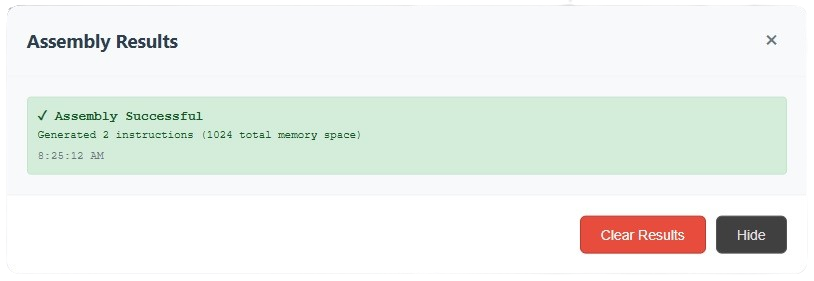
Assembly Process
The assembler converts your PIC assembly code into machine code that can be executed by the simulator.
Supported Instructions
Data Movement
MOVLW, MOVWF, MOVF, SWAPF, CLRF, CLRW
Arithmetic
ADDWF, SUBWF, ADDLW, SUBLW, INCF, DECF
Logic
ANDWF, IORWF, XORWF, ANDLW, IORLW, XORLW
Control Flow
GOTO, CALL, RETURN, RETLW, RETFIE
Directives
Error Handling
The assembler provides detailed error messages to help you fix issues in your code:
- Syntax errors
- Undefined labels
- Invalid operands
- Memory address conflicts
Simulator
Simulation Controls
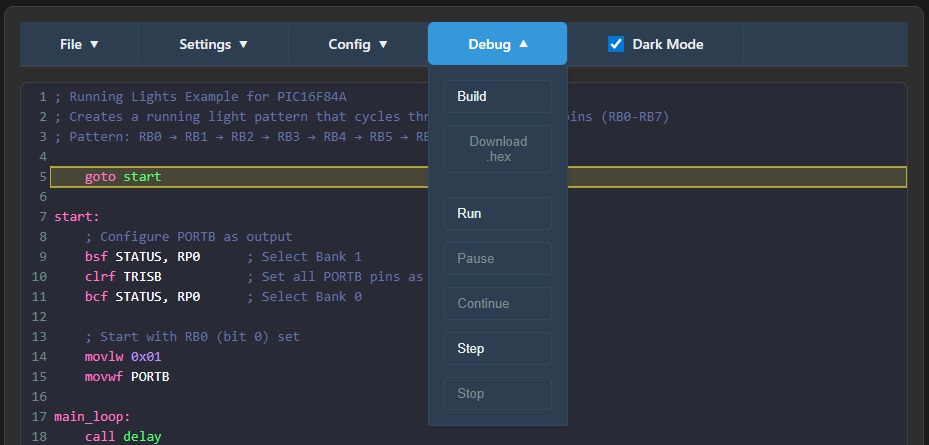
Control Buttons
Run
Start continuous execution of your program
Pause
Pause the current execution while maintaining state
Continue
Resume execution from where it was paused
Step
Execute one instruction at a time for debugging
Stop
Stop the current execution
Execution Modes
- Continuous: Run at full speed
- Paused: Execution paused while maintaining current state
- Step-by-step: Execute one instruction at a time
- Breakpoints: Stop at specific instructions for debugging
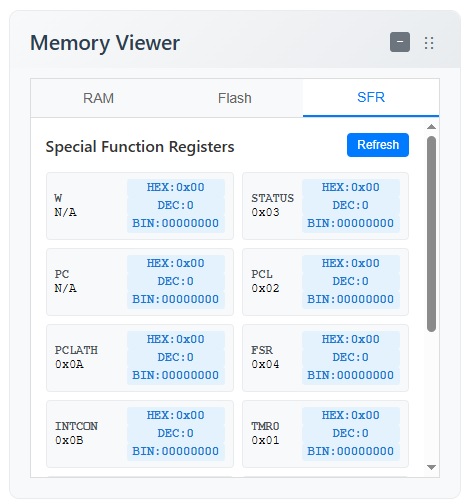
Register Display
The simulator displays the current state of all PIC registers in real-time:
- W (Working) Register
- Status Register (flags)
- Program Counter
- Stack Pointer
- All Special Function Registers
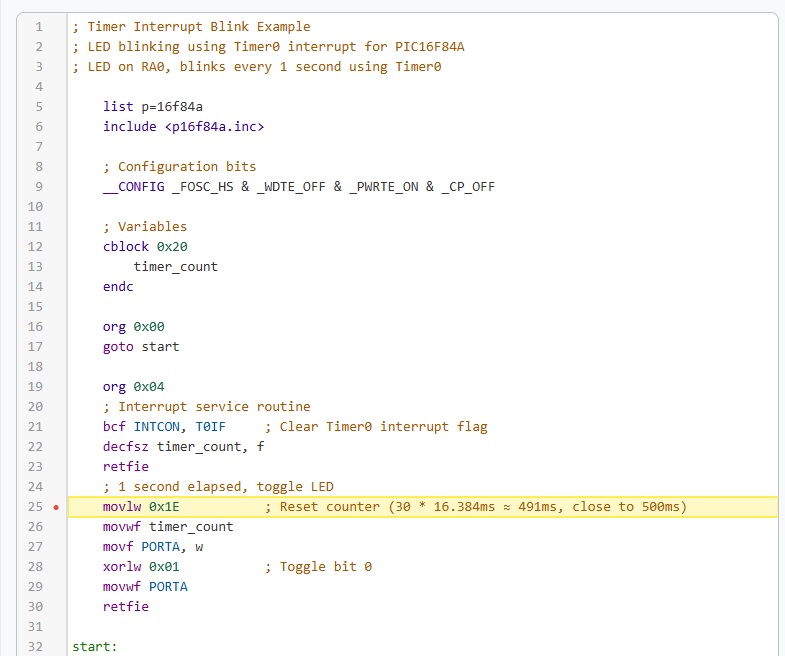
Breakpoints
Overview
Breakpoints are a powerful debugging feature that allows you to pause program execution at specific lines of code. This is essential for debugging complex programs and understanding program flow.
Setting Breakpoints
Click to Toggle
Click on any line number in the code editor to set or remove a breakpoint
Visual Indicators
Breakpoints are marked with red circles next to line numbers
Persistent Storage
Breakpoints are automatically saved and restored when you reload the page
Breakpoint Management
Breakpoint Panel Features
- Active Breakpoints: Shows all currently set breakpoints with their addresses
- Remove Individual: Click the "×" button to remove a specific breakpoint
- Clear All: Remove all breakpoints at once
- Breakpoint Count: Displays the total number of active breakpoints
Using Breakpoints for Debugging
Debugging Workflow
- Set Breakpoints: Click on line numbers where you want to pause execution
- Run Program: Click "Run" to start execution
- Inspect State: When execution pauses at a breakpoint, examine registers and memory
- Continue: Use "Continue" to resume execution until the next breakpoint
- Step Through: Use "Step" to execute one instruction at a time from the breakpoint
Breakpoint Best Practices
- Strategic Placement: Set breakpoints at critical points in your code
- Loop Debugging: Place breakpoints inside loops to monitor iteration behavior
- Function Entry: Set breakpoints at the start of subroutines to trace function calls
- Error Conditions: Place breakpoints where you suspect errors might occur
- Clean Up: Remove breakpoints when debugging is complete
Breakpoint Limitations
- Breakpoints can only be set on executable lines (not comments or labels)
- Maximum of 16 breakpoints can be active at once
- Breakpoints are cleared when loading a new example program
GPIO Controls
Port Configuration
Control the GPIO pins of the simulated PIC microcontroller to interact with your programs.
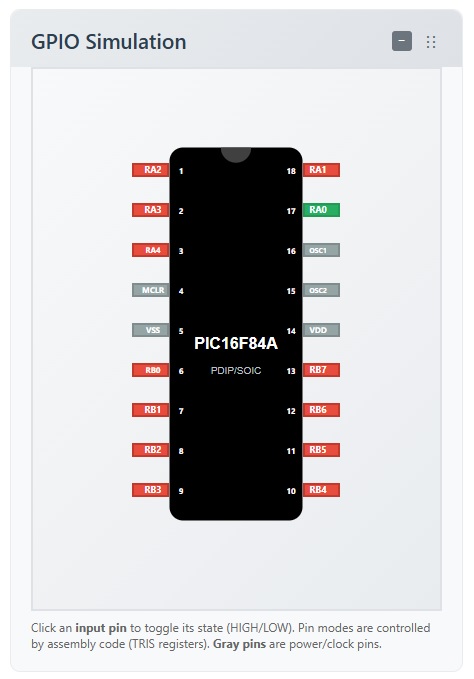
PORTA (5 pins)
RA0-RA4
Individual pin controls with input/output toggle and state display
PORTB (8 pins)
RB0-RB7
Individual pin controls with input/output toggle and state display
Pin States
- Input: Pin configured as input (high impedance)
- Output: Pin configured as output (drives high or low)
- High: Pin state is logic high (5V)
- Low: Pin state is logic low (0V)
Visual Indicators
Each pin has visual indicators showing:
- Current state (high/low)
- Direction (input/output)
- Activity (blinking for toggling)
Widget Management
Customizable Workspace
PIC Simulator includes a comprehensive widget management system that allows you to customize your workspace by showing or hiding specific widgets based on your needs. This feature helps you focus on the tools you use most while keeping your interface clean and organized.
Accessing Widget Management
You can access widget management through the main menu bar:
- Click on the "Widgets" menu in the main menu bar
- Select "Manage Widgets" to open the management dialog
- Or use quick actions: "Show All" or "Hide All"
Available Widgets
The following widgets can be individually shown or hidden:
GPIO Grid
Interactive GPIO pin control for PORTA and PORTB
Breakpoints
Debug breakpoint management and monitoring
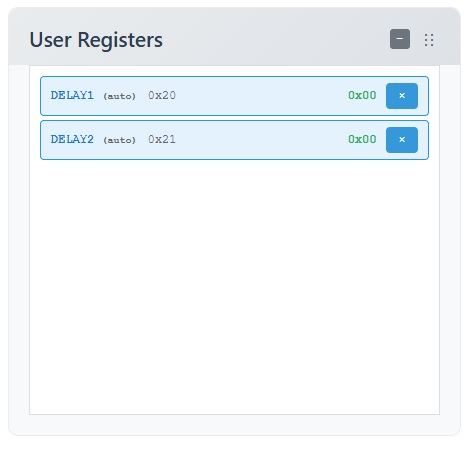
User Registers
Custom register monitoring and auto-detection
Interrupt Table
Interrupt status and vector monitoring
Seven Segment
7-segment display simulation and visualization
LED Array
LED array visualization and control
Switch Array
Switch input simulation and testing
LCD Display
16x2 LCD display simulation
Flag Table
Status flags monitoring and display
Stack Viewer
Call stack visualization for debugging
Memory Viewer
RAM, Flash, and SFR memory inspection
Widget Management Interface
The widget management modal provides an intuitive interface for customizing your workspace:
Individual Widget Control
- Checkboxes: Each widget has a checkbox to show/hide it
- Descriptions: Clear descriptions help you understand each widget's purpose
- Real-time Preview: Changes are applied immediately when you click "Apply Changes"
Bulk Operations
- Show All: Display all available widgets
- Hide All: Hide all widgets for a minimal interface
- Reset to Default: Restore the default widget configuration
Persistent Preferences
Your widget preferences are automatically saved and restored:
- Automatic Saving: Your choices are saved to browser localStorage
- Session Restoration: Your widget configuration is restored when you reload the page
- Default Behavior: All widgets are shown by default for new users
Workflow Optimization
Use widget management to optimize your development workflow:
- Debugging: Show only breakpoints, memory viewer, and stack viewer
- GPIO Testing: Focus on GPIO grid, LED array, and switch array
- Display Development: Show seven segment and LCD display widgets
- Minimal Interface: Hide all widgets for distraction-free coding
Memory View
Memory Organization
View and monitor the memory contents of the simulated PIC microcontroller.
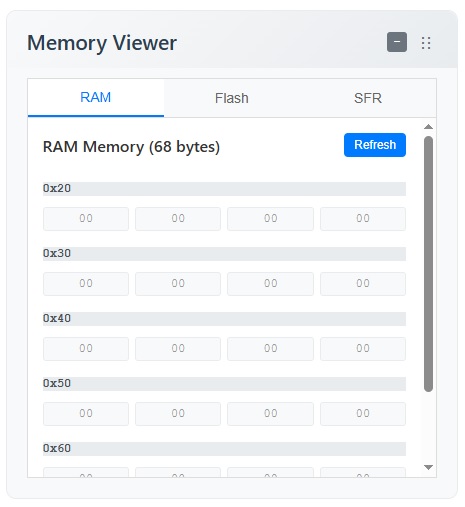
Memory Types
RAM (Data Memory)
68 bytes of general-purpose RAM for variables and data storage
Flash (Program Memory)
1024 words of program memory containing your assembled code
EEPROM (Coming Soon)
64 bytes of non-volatile memory for persistent data storage
Memory Display Features
- Hexadecimal address display
- Real-time value updates
- Memory range highlighting
- Search and filter capabilities
User Registers
The simulator automatically detects and displays user-defined variables:
- EQU constants
- CBLOCK variables
- Custom labels
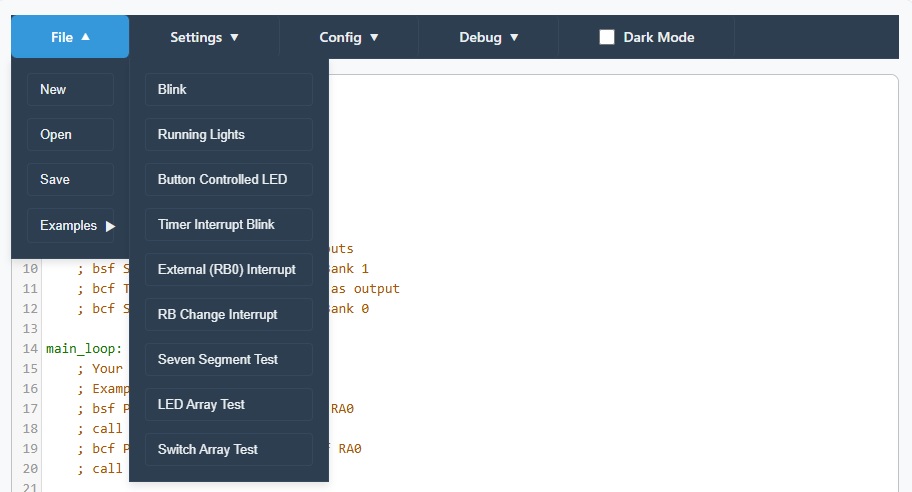
Examples
Built-in Examples
PIC Simulator includes several example programs to help you learn PIC assembly programming. When you first start the application, you'll see a blank template instead of an example.
Blink
Simple LED blinking program using RA0 and RB0 pins
Running Lights
Flash LEDS on PORTB
Button Controlled LED
Button input controls LED state
Timer Interrupt Blink
LED blinking using Timer0 interrupt with sleep mode
External RB0 Interrupt
External interrupt example using RB0 pin
RB Change Interrupt
RB4 to RB7 change interrupt example
Seven Segment Test
Single digit counter using seven-segment display patterns
LED Array Test
Example to test LED array functionality
Switch Array Test
Example to test switch array functionality
Loading Examples
- Click on the "Examples" menu
- Select the example you want to try
- The code will load into the editor
- Click "Assemble" to compile
- Click "Run" to execute
Modifying Examples
Feel free to modify the example code to experiment and learn:
- Change timing delays
- Modify pin assignments
- Add new functionality
- Create your own variations
Troubleshooting
Common Issues
Assembly Errors
Solution: Check spelling and ensure the instruction is supported by the PIC16F84A
Simulation Issues
Solution: Check GPIO pin configuration and ensure pins are set as outputs
Memory Issues
Solution: Ensure memory addresses are within valid ranges (RAM: 0x00-0x4F)
Debugging Tips
- Use step-by-step execution to trace program flow
- Monitor register values during execution
- Check GPIO pin states and directions
- Verify memory contents match expectations
- Use the assembler error messages to fix syntax issues
Performance Tips
- Keep programs simple for better simulation performance
- Use appropriate delay values for timing
- Avoid infinite loops without delays
- Monitor memory usage to avoid overflow